Business intelligence like never before
Microsoft Power BI is a suite of business analytics tools that deliver insights throughout your organization. Connect to hundreds of data sources, simplify data prep, and drive ad hoc analysis. Produce beautiful reports, then publish them for your organization to consume on the web and across mobile devices. Everyone can create personalized dashboards with a unique, 360-degree view of their business. And scale across the enterprise, with governance and security built-in.
Go from data to insights in minutes. Any data, any way, anywhere. And all in one view!
- For analyst
Quickly go from data to insight to action. Connect to hundreds of sources, prep data with ease, and create beautiful reports, all in minutes.
- For business users
Always be in the know. View dashboards on the web or on your phone, get alerts when data changes, and drill into details. your data is at your fingertips.
- For IT
Simplify management, achieve compliance, and keep data secure while giving people access to the insights they need.
- For developers
Bring your apps to life with data. Easily embed interactive data visuals and deliver compelling reports – with high fidelity, on any device.
Analysts – Create stunning reports and visualizations with Microsoft Power BI Desktop
Microsoft Power BI Desktop puts visual analytics at your fingertips with intuitive report authoring. Drag-and-drop to place content exactly where you want it on the flexible and fluid canvas. Quickly discover patterns as you explore a single unified view of linked, interactive visualizations.
- Transform and clean data
Getting your data ready to analyze can be time-consuming. We’re on a mission to make it much simpler. Try the data shaping and modeling capabilities of Power BI Desktop and take back hours in your busy day.
- Complete analytics life-cycle
The Power BI Desktop is an elegant end-to-end solution for building analytics. The Desktop has all the capabilities to quickly connect, shape, visualize, and share data insights through Power BI.
- Design once, view anywhere
We know you need to get data into the hands of decision makers when and where they need it. Power BI makes publishing and sharing your beautiful interactive reports easy.
Business users – Find the right solution for your organization
Power BI turns industry data into smart decisions. Your industry generates a huge amount of information every day. But are you putting that data to work for you? Power BI makes it easy to combine your data, find new insights, and share them with others.

- Retail
Shopping is not what it used to be. Today shoppers are empowered with devices, options and more information at their fingertips. Get visibility into the insights that will make your business successful.
- Insurance
Data is pouring in from insurance companies operations: policy sales, claims, fraud, coverage complexity and premiums all provide companies with a rich set of trends and insights that are waiting to tapped.
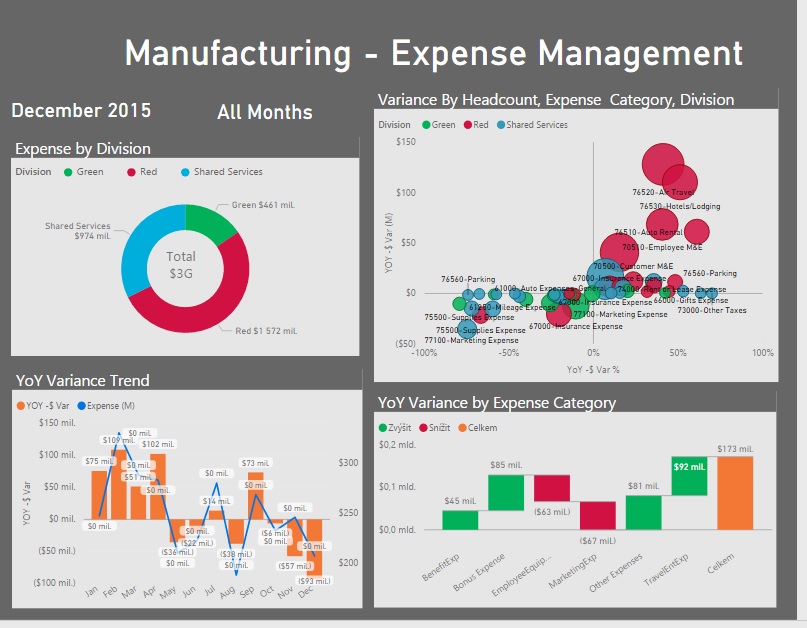
- Manufacturing
The manufacturing process needs to be a well-oiled machine to succeed and the best way of achieving that goal is to have visibility on every process while seeing the big picture.
- Professional Services
Professional services firms have one thing in common: their most important asset is their people. Support your professionals with the right data and technology to maximize value delivered to your clients.
- Telecommunications
Learn how a telecommunication company, operating a mobile business, can leverage Cortana Intelligence Suite and Microsoft Power BI to empower business stakeholders to analyze factors contributing to customer.
- Energy
This report focuses on demand forecasting within the energy sector. The views provide region level energy usage status and forecast of future usage for optimizing the operations.
- Public Sector
Public Sector data is available via various sources online. Most of these data sources are free as well. This provides with an amazing opportunity to correlate how the public policies are affecting changes from Climate to Education to Health and more.
- Capital Markets
The U.S. Personal Consumption Expenditure dashboard tracks consumer spending in the US across a wide range of goods and services to track the US business cycle as well as gauge spending trends and economic sentiment.
BI built for IT—from the company you already trust
Your business needs insights to make decisions at every level, in real time. Build a data culture where every person is empowered. Help them do their best work with familiar tools to get insights in seconds. At the same time, meet your security, governance, and regulatory requirements with an enterprise business intelligence (BI) platform you can trust.
- Tools your organization knows
Employees already use Microsoft products. Reduce training and support costs by taking advantage of these familiar tools—on PCs, the web, and mobile—as part of your enterprise BI deployment.
- Quick deployment
Reduce implementation costs and simplify management. Deploy and manage Power BI the same way as Microsoft 365 and other Microsoft services you run in your organization.
- Governance and security—at scale
Keep tabs on your enterprise data. Centrally control how data is accessed and used—even on mobile devices. Set and monitor policies, detect anomalies, and take action.
Developers – Apps energized with analytics
Embed Power BI in your apps. Delivering business intelligence (BI) to help people make better decisions is a challenge. Data is complex, devices are many, attention spans are short. Integrate analytics with your apps to provide data visualizations and insights where people work. Where decisions are made. With real-time updating and data in context, you’ll help people make better and more meaningful decisions.
- Embed world-class analytics in your apps
Quickly and deeply integrate easy-to-use analytics in your apps to speed decision making.
- Capitalize on analytics built for the cloud
Gain the benefits of the cloud: flexible pricing, scale, compliance, security, and reliability.
- Benefit from an open and extensible platform
Develop in a familiar environment, on an open and extensible platform with powerful SDKs and APIs.

Create data dashboards and visualizations in minutes
Less than five minutes. That’s all it takes to start transforming your data into live dashboards and reports that’ll help you find answers to your company’s most important questions.
| Are you interested in this product? We will be happy to answer your questions, feel free to contact us using the form below. |